
IoT, visualization, and productivity improvement are common words and phrases. However, what conditions are required to have visualization that leads to results? What is needed to be able to immediately and correctly ascertain what the issue is so that proper action can be taken regardless of time, place, or employee’s experience?
Visualization has to be simple to understand and intuitive so that appropriate improvement activities can be carried out. Failure to take this into account will lead to visualization that does not lead to results. Traffic signals are a typical example of visualization that meet these criteria. We have also achieved this at our PATLITE facilities.
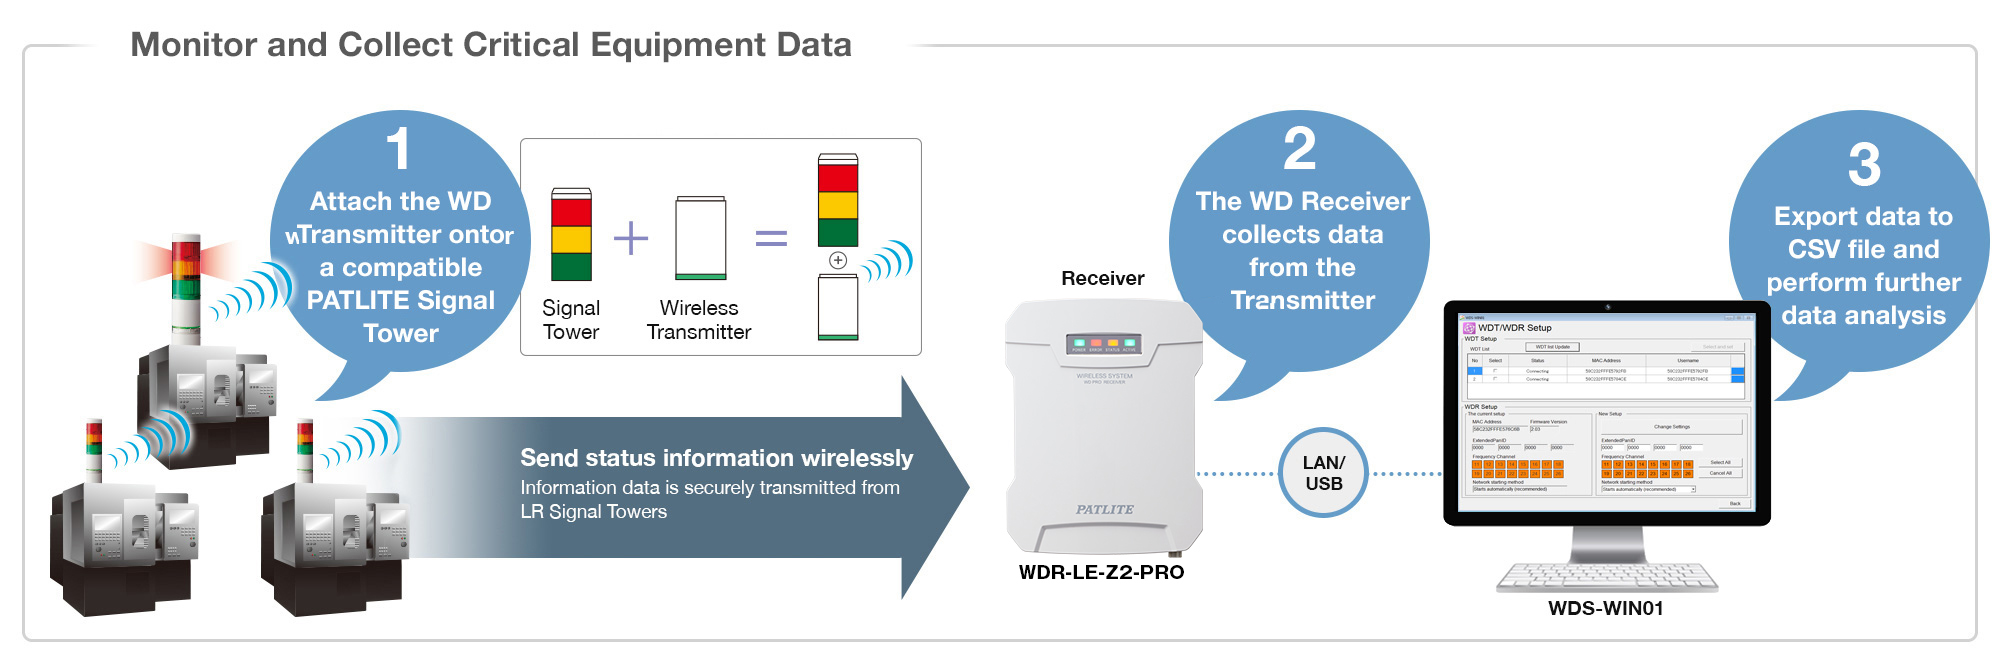
By gathering information from Signal Towers we will begin to see where improvements need to be made. As we take corrective action and begin to see results we will improve our processes and will begin to cultivate employees who become excited about continuous improvement. As this cycle begins and momentum builds, management issues can be solved as well, leading to a revitalization of the organization where all employees – from the shop floor to the executive office – are enthusiastic about continuous improvement and related activities.
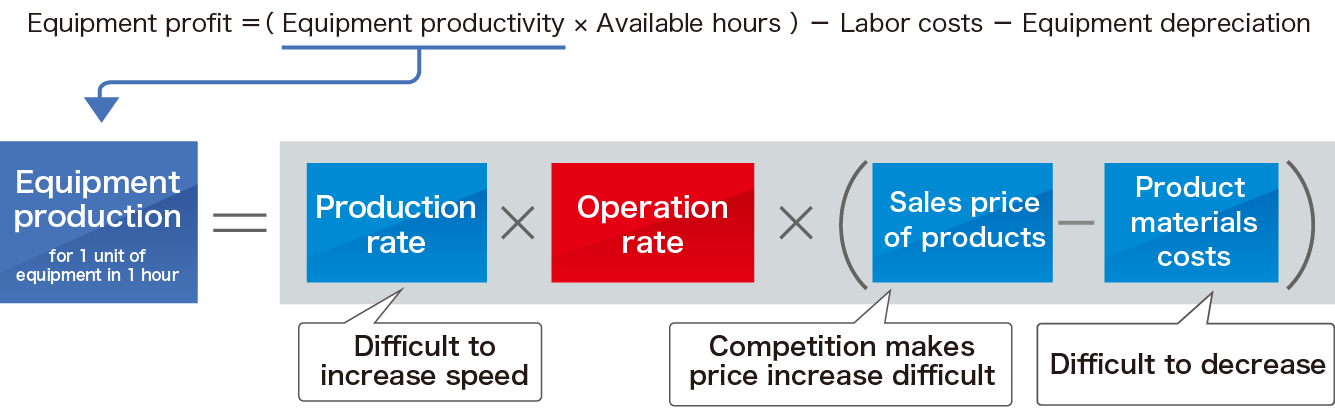
Equipment profit will increase when equipment productivity is improved.
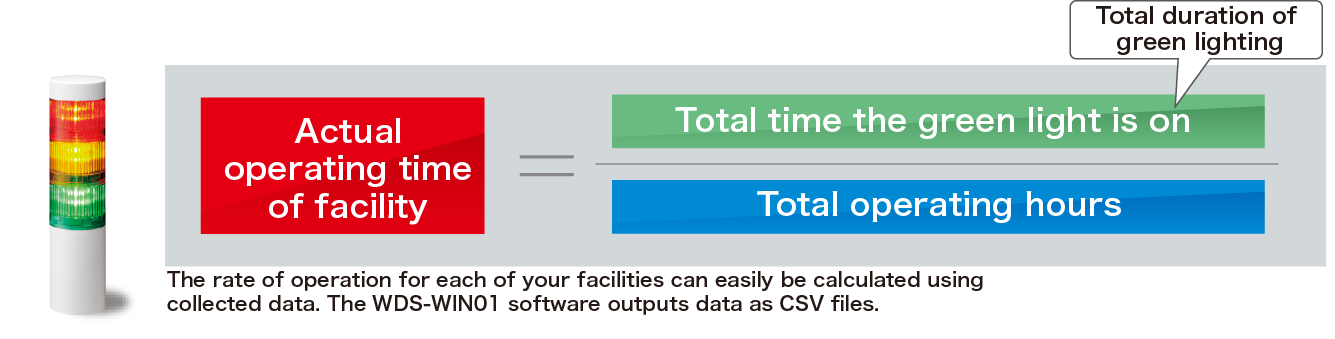
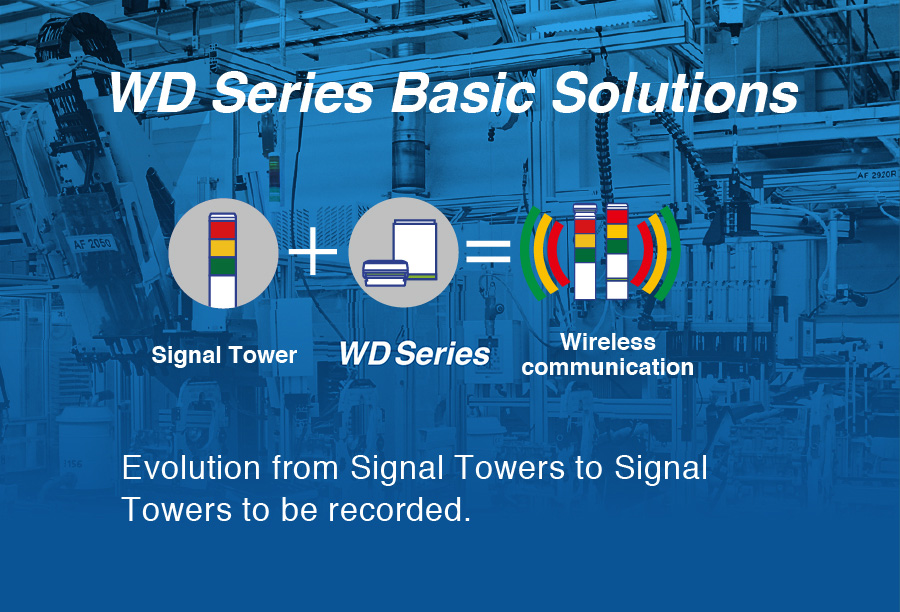
Signal Towers enable visualization
of operation time.
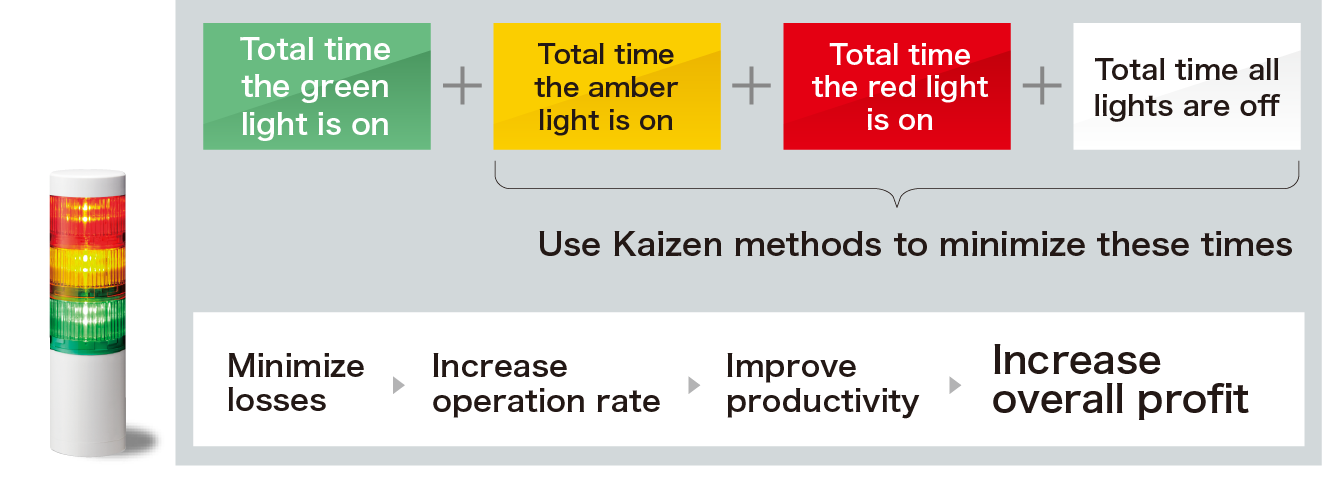
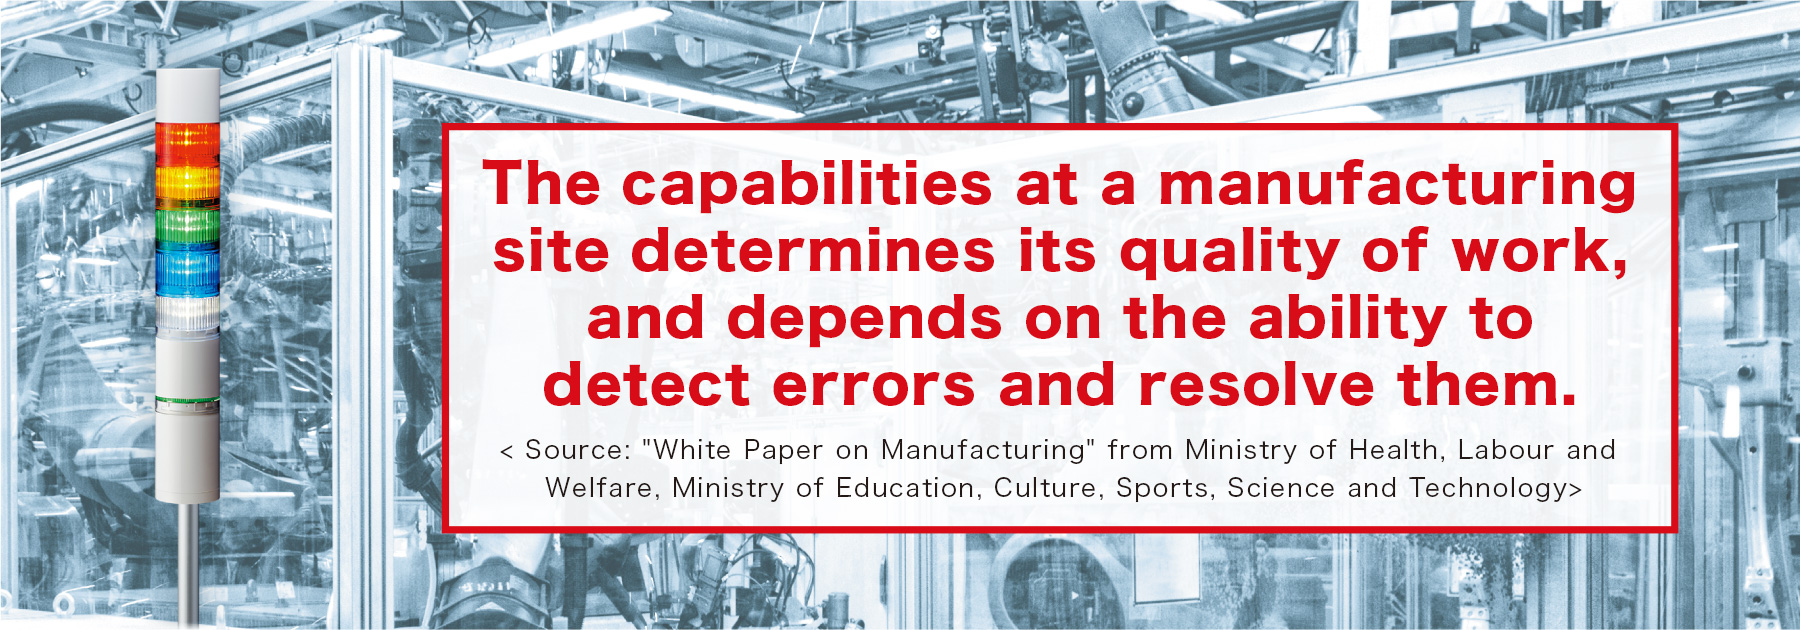
Improvements cannot be made until losses
can be visualized or made clear.